Graphing Linear Equations
To graph a linear equation, you can create a table of values (\(x\) and \(y\)) and then simply connect the points with a line. It is good practice to choose both positive and negative \(x\) values. Choose an \(x\)-value and then substiute the value in the equation to solve for \(y\). This will give you the \((x,y)\) point for the graph.
One strategy is to start at the \(y\)-intercept and then use the slope to determine the next point.
Example
Populate the table of values for \(y = 3x - 1\).
First, we can identify \(y\)-intercept is (\(0,-1\)); this gives us our first point:
| x Values | -2 | -1 | 0 | 1 | 2 |
|---|---|---|---|---|---|
| y Values | -1 |
Next, we can identify that the slope is \(+3\); this means when \(x\) increases by \(1\), \(y\) increases by \(3\). Let's populate the table for \(x=1,2\):
| x Values | -2 | -1 | 0 | 1 | 2 |
|---|---|---|---|---|---|
| y Values | -1 | 2 | 5 |
Then, to populate the other values in the table, we can decrease \(x\) by \(1\) and decrease \(y\) by \(3\):
| x Values | -2 | -1 | 0 | 1 | 2 |
|---|---|---|---|---|---|
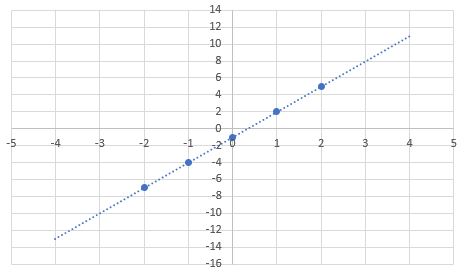
| y Values | -7 | -4 | -1 | 2 | 5 |
Finally, we can plot the points on a graph and connect them with a line. The line extends in both directions.
From the equation, we can identify the \(y\)-intercept to be \(2\). That means when \(x\) equals \(0\), the \(y\)-coordinate will be equal to \(2\).
The slope is \(5\) (positive). This means for every increase in \(x\) by \(1\), the \(y\)-value will increase by \(5\).
Next, we can create a table of values:
| x Values | -2 | -1 | 0 | 1 | 2 |
|---|---|---|---|---|---|
| y Values | -8 | -3 | 2 | 7 | 12 |
Then, we can graph the equation based on the table of values:

First, we can identify the y-intercept to be \((0, -2)\) from looking at the equation. That means when \(x\) equals \(0\), the \(y\)-coordinate will be equal to \(-2\).
The slope is \(-5\) (negative). This means for every increase in \(x\) by \(1\), the \(y\)-value will derease by \(2\).
Next, we can create a table of values:
| x Values | -2 | -1 | 0 | 1 | 2 |
|---|---|---|---|---|---|
| y Values | 2 | 0 | -2 | -4 | -6 |
Then, we can graph the equation based on the table of values:
