Distance vs Time Graphs
One of the most common examples of a linear relation is the relationship between distance and time when a travelling at a constant speed. For exmaple, if you are travelling \(40 \; [\text{km/h}]\) then every hour you will travel \(40 \; [\text{km}]\).
A distance-time graph shows an object's distance from a fixed point over a period of time.
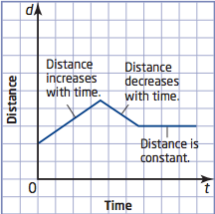
A rising line shows that the object's distance increases away from the reference point.
A falling line shows that the object's distance decreases towards the reference point.
A flat line shows the object isn't moving!
Velocity
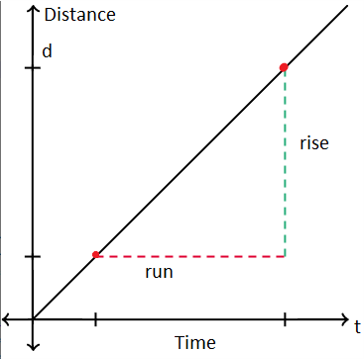
In distance vs time graphs, the distance should be represented on the vertical axis. Time would be the horizontal axis, and the velocity would be represented by the slope of the graph.
In order to calculate the slope, we can use its corresponding formula:
\(m = \cfrac{\text{rise}}{\text{run}} = \cfrac{y_2-y_1}{x_2-x_1} = \cfrac{d_2-d_1}{t_2-t_1} = v\)
From this equation we can see that the speed is distance over time:
\(v = \cfrac{d}{t}\)
This can be represented graphically as such:
D vs T Graphs
To better demonstrate how to calculate rate of change on a distance-time graph refer to Timmy's shopping trip below:
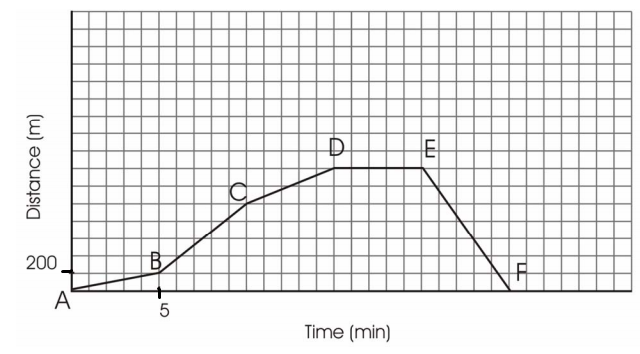
We can determine the speed of each segment by using the slope formula:
\(m = \cfrac{y_2-y_1}{x_2-x_1}\)
We can then substitute the appropriate values into the formula for each segment and solve for their respective speeds:
\(m_{\text{AB}} = \cfrac{200-0}{5-0}= \cfrac{200}{5} = 40 \; \left[\cfrac{\text{m}}{\text{min}}\right]\)
\(m_{\text{BC}} = \cfrac{1000-200}{10-5} = \cfrac{800}{5} = 160 \; \left[\cfrac{\text{m}}{\text{min}}\right]\)
\(m_{\text{CD}} = \cfrac{1400-1000}{15-10} = \cfrac{400}{5} = 80 \; \left[\cfrac{\text{m}}{\text{min}}\right]\)
\(m_{\text{DE}} = \cfrac{1400-1400}{20-15} = \cfrac{0}{5} = 0 \; \left[\cfrac{\text{m}}{\text{min}}\right]\)
\(m_{\text{EF}} = \cfrac{0-1400}{25-20}= \cfrac{-1400}{5} = -280 \; \left[\cfrac{\text{m}}{\text{min}}\right]\)
Timmy was moving the fastest during the last \(5 \; [\text{min}]\) of his trip, interval \(\textbf{EF}\).