Transformations of Sine Functions
As with other functions, transformations can be applied to sine functions. The transformed versions of these functions can be expressed as:
These transformations can alter their key characteristics such as domain, range and intercepts. They include:
- \(a\) represents the vertical stretch/compression and reflection in x-axis
- \(k\) represents the horizontal stretch/compression and reflection in y-axis
- \(d\) represents the horizontal shift
- \(c\) represents the vertical shift
NOTE: When graphing a sine function, \(c\) also acts as the function's axis!!
Example
State the transformations for \(f(x) = \cfrac{1}{2}\sin(x) + 2\)
We can determine the transformations as such:
- \(\boldsymbol{a = 1/2}\): Vertical compression by a factor of \(1/2\)
- \(\boldsymbol{c = 2}\): Vertically shifted upwards \(2\) units
\(f(x) = -2\cos(0.75x) - 3\)
We can determine the transformations as such:
- \(\boldsymbol{a = -2}\): Vertical stretch by a factor of \(5\) and reflection in the \(x\)-axis
- \(\boldsymbol{k = 0.75}\): Horizontal stretch by a factor of \(4/3\)
- \(\boldsymbol{c = -3}\): Vertically shifted downwards \(3\) units
\(f(x) = 2.5\sin(2x-60°)\)
First, we need to factor \(k\) out of the brackets in order to determine \(d\):
\(= 2x - 60°\)
\(= 2(x - 30°)\)
Now, we can determine the transformations as such:
- \(\boldsymbol{a = 2.5}\): Vertical stretch by a factor of \(2.5\)
- \(\boldsymbol{k = 2}\): Horizontal compression by a factor of \(1/2\)
- \(\boldsymbol{d = 30°}\): Horizontally shifted \(30°\) right
Enter in the values for the sinusoidal function or click on the button to generate random values. Entering these values will generate a graph comparing the base sinusoidal function to the transformed one.
Sketching Sinusoidals
In order to sketch a sine function, we need to first identify its key characteristics, including its axis, max and min points, and period. Here are the steps needed to find them:
- Draw three horizontal lines respectively representing the max, min, and axis
- Find the period, \(\left(\cfrac{360°}{k}\right)\)
- Decide the shape of the graph, sine or cosine
- Label five points horizontally on the cycle
Example
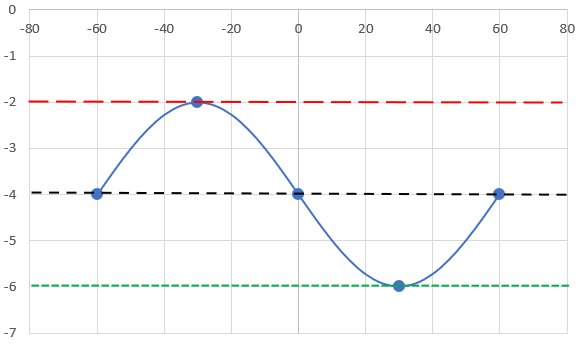
State all key characteristics of \(f(x) = -2\sin(3θ+180)-4\) then sketch its graph.
First, we can put the function in its proper form by factoring out \(k\):
\(f(θ) = -2\sin(3θ+180)-4\)
\(f(θ) = -2\sin[3(θ+60)]-4\)
Next, we can determine the transformations to help determine the function's key characteristics:
- \(a = -2\): Vertical stretch by a factor of \(2\) and reflection in the \(x\)-axis
- \(k = 3\): Horizontal compression by a factor of \(1/3\)
- \(d = 60\): Horizontally shifted \(60°\) left
- \(c = -4\): Vertically shifted 4 units downward
Then, since we have already determined the function's axis, \(-4\), and amplitude, \(2\), we can use this information to determine its max and min points.
We can determine the max by adding the axis value to \(c\):
\(\text{max} = c + \text{axis}\)
\(\text{max} = -4 + 2\)
\(\textbf{max} \boldsymbol{= -2}\)
We can determine the min by subtracting the axis value from \(c\):
\(\text{min} = c - \text{axis}\)
\(\text{min} = -4 - 2\)
\(\textbf{min} \boldsymbol{= -6}\)
We can also determine the function's period since we have identified \(k\) (\(3\)):
\(\text{period} = \cfrac{360°}{k}\)
\(\text{period} = \cfrac{360°}{3}\)
\(\textbf{period} \boldsymbol{= 120°}\)
Since the sine function is split into four equal sections, we will need to determine how large each section is by dividing the period, \(120°\) by \(4\):
\(\text{section} = \cfrac{\text{period}}{4}\)
\(\text{section} = \cfrac{120°}{4}\)
\(\textbf{section} \boldsymbol{= 30°}\)
Before sketching our function, we can create a table of values with the five points that need to be placed horizontally on the cycle split into \(30°\) intervals:
| θ Values | -60 | -30 | 0 | 30 | 60 |
|---|---|---|---|---|---|
| f(θ) Values | -4 | -6 | -4 | -2 | -4 |
We can now sketch our graph:
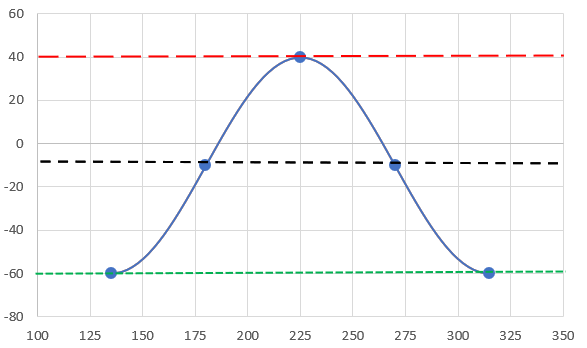
First, we can put the function in its proper form by factoring out \(k\):
\(f(x) = -50\cos(2x-270)°-10\)
\(f(x) = -50\cos[2(x-135)°]-10\)
Next, we can determine the transformations to help determine the function's key characteristics:
- \(a = -50\): Vertical stretch by a factor of 50 and reflection in the \(x\)-axis
- \(k = 2\): Horizontal compression by a factor of \(1/2\)
- \(d = 135\): Horizontally shifted \(135°\) right
- \(c = -10\): Vertically shifted \(10\) units downward
Then, since we have already determined the function's axis, \(-10\), and amplitude, \(50\), we can use this information to determine its max and min points:
We can determine the max by adding the axis value to \(c\):
\(\text{max} = c + \text{axis}\)
\(\text{max} = -10 + 50\)
\(\boldsymbol{\textbf{max} = 40}\)
We can determine the min by subtracting the axis value from \(c\):
\(\text{min} = c - \text{axis}\)
\(\text{min} = -10 - 50\)
\(\boldsymbol{\textbf{min} = -60}\)
We can also determine the function's period since we have identified \(k\) (\(3\)):
\(\text{period} = \cfrac{360°}{2}\)
\(\text{period} = \cfrac{360°}{2}\)
\(\boldsymbol{\textbf{period} = 180°}\)
Since the sine function is split into four equal sections, we will need to determine how large each section is by dividing the period, \(120°\), by \(4\):
\(\text{section} = \cfrac{\text{period}}{4}\)
\(\text{section} = \cfrac{180°}{4}\)
\(\boldsymbol{\textbf{section} = 45°}\)
Before sketching our function, we can create a table of values with the five points that need to be placed horizontally on the cycle split into \(45°\) intervals starting with \(135°\):
| x Values | 135 | 180 | 225 | 270 | 135 |
|---|---|---|---|---|---|
| f(x) Values | -60 | -10 | 40 | -10 | -60 |
We can now sketch our graph: