Modelling with Sinusoidals
As we've discussed in the previous functions, here are the formulas we use for sine and cosine functions:
- \(|a|\) refers to the amplitude (also the vertical stretch/compression factor)
- \(k\) refers to the period (also the horizontal stretch/compression factor)
- \(d\) refers to the horizontal shift
- \(c\) refers to the vertical shift
Example
Find two possible respective sine and cosine equations for the following graph:

From analyzing the graph above, we can identify the max and min points as \(19\) and \(1\) respectively.
First, we can determine the axis:
\(c = \cfrac{\text{max}+\text{min}}{2}\)
\(c = \cfrac{19+1}{2}\)
\(c = \cfrac{20}{2}\)
\(c = 10\)
Next, we can determine the amplitude:
\(a = \cfrac{\text{max}-\text{min}}{2}\)
\(a = \cfrac{19-1}{2}\)
\(a = \cfrac{18}{2}\)
\(a = 9\)
Then, we determine the period by using a pair of max points (\(60^{\circ}\) and \(180^{\circ}\)):
\(\text{Period} = \text{max}_2 - \text{max}_1\)
\(\text{Period} = 180^{\circ} - 60^{\circ}\)
\(\text{Period} = 120^{\circ}\)
We can now determine \(k\) using the period:
\(k = \cfrac{360°}{\text{period}}\)
\(k = \cfrac{360°}{120^{\circ}}\)
\(k = 3\)
Finally, we can determine the respective phase shifts. The sine functions can start at either \(30^{\circ}\) or \(150^{\circ}\). They typically start at the axis and increase to the maximum. Conversely, the cosine functions can start at either \(60^{\circ}\) or \(180^{\circ}\). They typically start at the minumim and increase to the axis.
Now that we have all our values, we can create our functions.
We can start with the sine functions:
\(\textbf{Sin}_1 \colon \boldsymbol{f(x) = 9\sin[3(x-30°)]+10}\)
\(\textbf{Sin}_2 \colon \boldsymbol{f(x) = 9\sin[3(x-150°)]+10}\)
We can continue with the cosine functions:
\(\textbf{Cos}_1 \boldsymbol{f(x) = 9\cos[3(x-60°)]+10}\)
\(\textbf{Cos}_2 \colon \boldsymbol{f(x) = 9\cos[3(x-180°)]+10}\)

From analyzing the graph above, we can identify the max and min points as \(-0.5\) and \(-3.5\) respectively.
First, we can determine the axis:
\(c = \cfrac{\text{max}+\text{min}}{2}\)
\(c = \cfrac{-0.5+(-3.5)}{2}\)
\(c = \cfrac{-4}{2}\)
\(c = -2\)
Next, we can determine the amplitude:
\(a = \cfrac{\text{max}-\text{min}}{2}\)
\(a = \cfrac{-0.5-(-3.5)}{2}\)
\(a = \cfrac{3}{2}\)
\(a = 1.5\)
Then, we determine the period by using a pair of min points (\(0^{\circ}\) and \(4^{\circ}\)) over the # of periods (\(3\)):
\(\text{Period} = \cfrac{\text{min}_2 - \text{min}_1}{3}\)
\(\text{Period} = \cfrac{4^{\circ} - 0^{\circ}}{3}\)
\(\text{Period} = \cfrac{4^{\circ}}{3}\)
We can now determine \(k\) using the period:
\(k = \cfrac{360°}{\text{period}}\)
\(k = \cfrac{360°}{\cfrac{4}{3}}\)
\(k = (360°)\left(\cfrac{3}{4^{\circ}}\right)\)
\(k = 270\)
Finally, we can determine the respective phase shifts. The sine function can start at \(3^{\circ}\), whereas the cosine function can start at \(2^{\circ}\).
Now that we have all our values, we can create our functions.
We can start with the sine function:
\(\textbf{Sin} \colon \boldsymbol{f(x) = 1.5\sin[270(x-3°)]-2}\)
We can continue with the cosine function:
\(\textbf{Cos} \colon \boldsymbol{f(x) = 1.5\cos[270°(x-2°)]-2}\)
Word Problems
The average monthly temperature of a city in degress Farenheit are given below:
| Jan | Feb | Mar | Apr | May | June | July | Aug | Sept | Oct | Nov | Dec |
| 32 | 35 | 44 | 53 | 63 | 73 | 77 | 76 | 69 | 57 | 47 | 37 |
Given the information provided:
- Sketch the data
- Find an approxiamte equation the would model this data. Assume that \(x=1\) is the start of January.
- What part(s) of the equation will change if the data was taken from a warmer climate?
i. We can draw a graph to visualize the data:
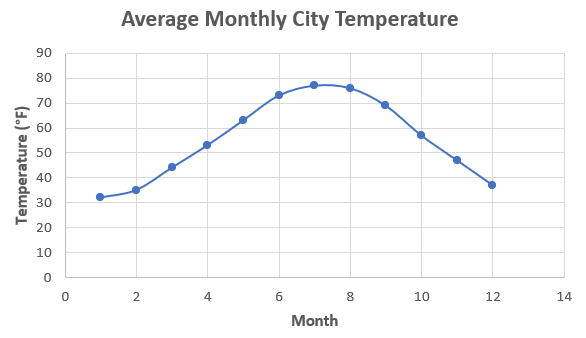
ii. Given that there isn't a clear midpoint, we will use opt to use a cosine function rather than a sine function to represent this graph.
From analyzing the graph, we can identify the max and min points as \(77\) and \(32\) respectively.
First, we can determine the axis:
\(\text{axis} = \cfrac{77+32}{2}\)
\(\text{axis} = \cfrac{109}{2}\)
\(\text{axis} = 54.5\)
Next, we can determine the amplitude:
\(a = \cfrac{77-32}{2}\)
\(a = \cfrac{45}{2}\)
\(a = 22.5\)
We can easily determine the period since its the length of one year in months (\(12\)).
Then, we can determine \(k\) using the period:
\(k = \cfrac{360°}{12}\)
\(k = 30°\)
Finally, we can determine from looking at the graph that the phase shift of the cosine function is \(7\) (as that's where the max lies).
Now that we have all our values, we can write our function:
Therefore, we can determine the function that approximately represents this data is \(\boldsymbol{f(x) = 22.5\cos[30°(x-7)]+54.5}\).
iii. Here's how the equation would change if the data was taken from a warmer climate:
- \(\boldsymbol{c}\) would be higher for the higher average temperature
- \(\boldsymbol{d}\) would shift if the maximum temperature was in a different month
- \(\boldsymbol{a}\) would be lower since the temperature likely wouldn't fluctuate as much
\(\boldsymbol{k}\) wouldn't get affected by the temperature change since they rely on the period (which is always going to be \(12\)).
A conveyor belt is powered by \(2\) circular pulleys, one of radius \(5\;[\text{m}]\) and the other of \(3\;[\text{m}]\). Both pulleys have serial numbers on them, but when the conveyor belt starts, the serial numbers are in different positions. The bigger pulley, A, has the serial number starting at maximum height. The smaller pulley, B, has the serial number starting at minimum height, which is \(2\;[\text{m}]\) away from the floor.
The pulleys are also spinning at different speeds but have the same minimum height. Pulley A completes \(5\) revolutions in \(2\) minutes. Pulley B is faster, completing \(5\) revolutions in \(1\) minute.
- Find the period for each pulley.
- Sketch both functions.
- Find the equations that model the heights.
- Analyze the meaning of all constants and variables for the equation that describes Pulley A, in the context of the problem.
i. We can determine the periods of each pulley by using the angular speed formula and respective Times, then finding their inverses:
We can first determine the period for Pulley A:
\(\text{period}_{\text{A}} = \left(2.5\;[\text{min.}]\right)^{-1}\)
\(\text{period}_{\text{A}} = 0.4\;[\text{min.}]\)
We can then determine the period for Pulley B:
\(\text{period}_{\text{B}} = (5\;[\text{min.}])⁻¹\)
\(\text{period}_{\text{B}} = 0.2\;[\text{min.}]\)
Therefore, we can determine that the respective periods for Pulley's \(\textbf{A}\) and \(\textbf{B}\) are \(\boldsymbol{0.4\;[\textbf{min.}]}\) and \(\boldsymbol{0.2\;[\textbf{min.}]}\) respectively.
ii. Before sketching both functions, we need to find additional values. As of now, we can only identify the functions' respective amplitudes, periods, and min points.
First, we can determine the max values for both pulleys using their respective min and amplitude values:
\(\text{max} = \text{min} + 2(\text{amplitude})\)
We can determine the max value for Pulley A by plugging in its min and amplitude values (\(2\) and \(5\) respectively) and solving:
\(\text{max}_{\text{A}} = 2 + 2(5)\)
\(\text{max}_{\text{A}} = 2 + 10\)
\(\text{max}_{\text{A}} = 12\)
We can then determine the max value for Pulley B by plugging in its min and amplitude values (\(2\) and \(3\) respectively) and solving:
\(\text{max}_{\text{B}} = 2 + 2(3)\)
\(\text{max}_{\text{B}} = 2 + 6\)
\(\text{max}_{\text{B}} = 8\)
Next, we can determine the axis for both Pulleys using their respective max and min values:
We can first determine the axis for Pulley A by plugging in its max and min values (\(12\) and \(2\) respectively) and solving:
\(\text{axis}_{\text{A}} = \cfrac{12+2}{2}\)
\(\text{axis}_{\text{A}} = \cfrac{14}{2}\)
\(\text{axis}_{\text{A}} = 7\)
We can then determine the axis value for Pulley B by plugging in its max and min values (\(8\) and \(2\) respectively) and solving:
\(\text{axis}_{\text{B}} = \cfrac{8+2}{2}\)
\(\text{axis}_{\text{B}} = \cfrac{10}{2}\)
\(\text{axis}_{\text{B}} = 5\)
Next, we can determine the \(k\) values for both pulleys using their respective periods (\(0.4\) and \(0.2\)):
\(k = \cfrac{360°}{\text{period}}\)
We can first determine the \(k\)-value for Pulley A:
\(k_{\text{A}} = \cfrac{360°}{0.4}\)
\(k_{\text{A}} = 900°\)
We can then find the \(k\)-value for Pulley B:
\(k_{\text{B}} = \cfrac{360°}{0.2}\)
\(k_{\text{B}} = 1800°\)
We can create respective tables of values for both Pulleys to help sketch our graphs more accurately:
Pulley A| Time (minutes) | 0 | 0.1 | 0.2 | 0.3 | 0.4 |
|---|---|---|---|---|---|
| Height (m) | 12 | 7 | 2 | 7 | 7 |
Pulley B
| Time (minutes) | 0 | 0.05 | 0.1 | 0.15 | 0.2 |
|---|---|---|---|---|---|
| Height (m) | 2 | 5 | 8 | 5 | 2 |
We can now sketch our respective graphs as such:


iii. We will use sine functions to model the heights. The only value(s) that we need to determine for both functions is the horizontal shift. We can do this by identifying the point at the axis that goes toward the max.
By looking at the graphs, we can identify the horizontal shift for Pulley A as \(0.3\). Likewise, we can identify the horizontal shift for Pulley B as \(0.05\). Now, we can write our functions:
\(\text{Sin}_\text{A}: h(t)=5\sin[900(t-0.3)]+7\)
\(\text{Sin}_\text{B}: h(t)=3\sin[1800(t-0.05)]+5\)
Therefore, we can determine the function for Pulley \(\textbf{A}\) is \(\boldsymbol{h(t)=5\sin[900(t-0.3)]+7}\).
We can also determine the function for Pulley \(\textbf{B}\) is \(\boldsymbol{h(t)=3\sin[1800(t-0.05)]+5}\).
iv. We can determine of all constants and variables for Pulley A's function as such:
- \(h(t)\) represents the height of Pulley A's number in relation to the time
- \(t\) represents the time in minutes
- \(a=5\) represents the radius of Pulley A
- \(c=7\) represents the axle of the rotating pulley
- \(k=900°\) doesn't have any meaning. However, it's related to the period which is based on speed