Intro to Sinusoidals
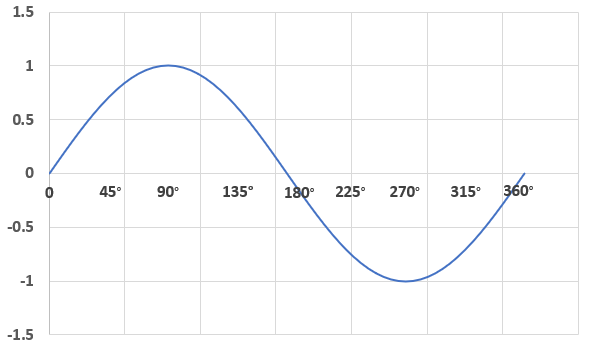
Sinusoidals are used to describe curve, also referred to as a sine wave or sinusoid, that exhibits smooth, periodic oscillation. They are used in various fields such as math, physics, medicine, and engineering.
Sinusoidal functions are expressed algebraically as:
- \(f(x)\) refers to the dependent variable
- \(x\) refers to the independent variable
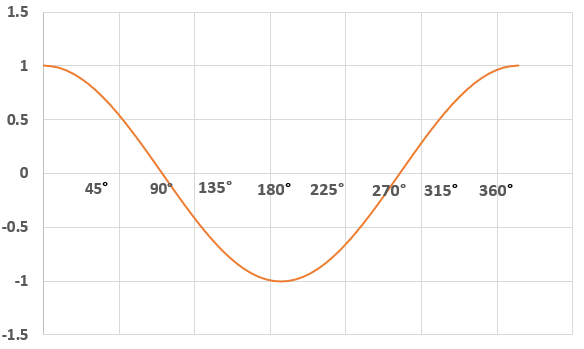
Cosine functions are expressed algebraically as:
Characteristics of a Sinusoidal
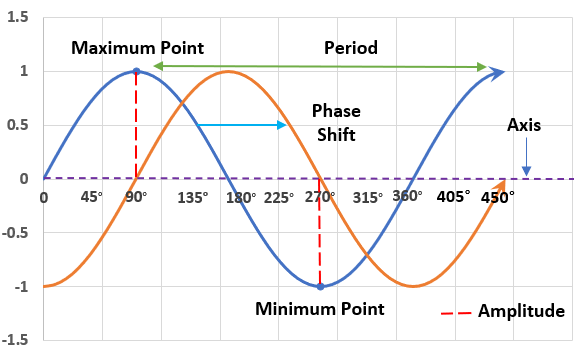
Cycle
- A series of events that are regularly repeated, a complete set of changes, starting from one point and returning to the same point in the same way
Period
- The interval needed to complete a cycle
- Can also be described as the distance between two successive maximum or minimum points
- Lasts for \(360°\) (or \(2π\)) by default
- Is measured in seconds/cycle
- Is inversely proportional to frequency or \(\cfrac{1}{f}\)
Frequency
- How often a cycle repeats itself
- Is measured in cycle/second
- Is inversely proportional to period or \(\cfrac{1}{T}\)
Maximum Point
- Refers to the highest point (or peak) in a sinusoidal graph
- Measured as \(1\) by default
Minimum Point
- Refers to the lowest point (or valley) in a sinusoidal graph
- Measured as \(-1\) by default
Axis
- A horizontal line which passes through the middle of the sine wave
- The average value of peaks (max points) and valleys(min points)
- Measured as \(0\) by default
- Can be calculated as \(\cfrac{\text{max} + \text{min}}{2}\)
Amplitude
- The vertical distance from the axis to the max or min points
- Measured as \(1\) by default
- Can be calculated as \(\text{max} - \text{axis}\) or \(\text{axis} - \text{min}\)
Phase
- The horizontal position of a waveform with respect to one cycle
- Is most commonly referred to in Phase Shift which refers to how much a cycle gets horizontally shifted relative to the reference cycle
The Bay of Fundy, which is between New Brunswick and Nova Scotia, has the highest tides in the world. There can be no water on the beach at low tide, while at high tide, the water covers the beach.
- Why can you use periodic functions to model the tides?
- What is the change in depth from low to high tide?
- Determine the equation of the axis of the curve.
- What is the amplitude of the curve?
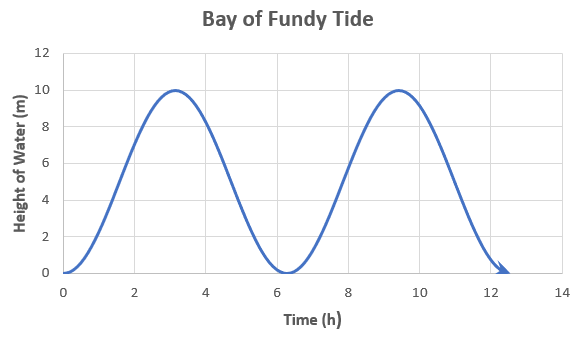
i. You can use periodic functions to model the tides since they repeat in cycles.
ii. The change in depth of water from low to high tide is \(\boldsymbol{0\;[\text{m}]}\) to \(\boldsymbol{10\;[\text{m}]}\).
iii. We can determine the axis as such:
\(\text{axis} = \cfrac{\text{max} + \text{min}}{2}\)
\(\text{axis} = \cfrac{10 + 0}{2}\)
\(\text{axis} = \cfrac{10}{2}\)
\(\text{axis} = 5\)
Therefore, we can determine that the axis is \(\boldsymbol{5}\).
iv. We can determine the amplitude as such:
\(\text{amplitude} = \text{max} - \text{axis}\)
\(\text{amplitude} = 10 - 5\)
\(\text{amplitude} = 5\)
Therefore, we can determine that the amplitude is \(\boldsymbol{5}\).