Data Management Software
There are many programs available to manage data, and Excel is one of the most popular tools. It lets you organize and analyze data in rows and columns. In Excel, you can perform calculations using formulas that refer to other cells. It can also create charts and perform advanced sorting and searching. You can add multiple sheets to a workbook and link data between them.
- Relational Databases: A type of database that stores data in tables with rows and columns. The relationships between the data in different tables are maintained using keys
- Functions: Built in formulas in Excel that perform specific tasks, such as SUM, AVERAGE, COUNT, and VLOOKUP, to perform calculations or manipulate data
- Cell References: The address of a cell in Excel (i.e. A1 or B2) that can be used in formulas to refer to data in specific cells. Absolute references (i.e. $A$1) do not change when copied, whereas relative references (i.e. A1) do
Excel Functions
Basic Calculation Functions

Excel can perform a wide variety of calculations, such as summing values with SUM(), calculating averages with AVERAGE(), and finding maximum or minimum values using MAX() and MIN().
Data Sorting & Filtering
- Sorting: Arrange data in ascending or descending order
- Filtering: Display only specific data by applying conditions
Excel allows you to quickly sort data based on different criteria such as alphabetical order, date, or numeric value. The filter feature can help isolate data based on set criteria, like showing only sales values greater than $1000.
Lookup & Reference Functions
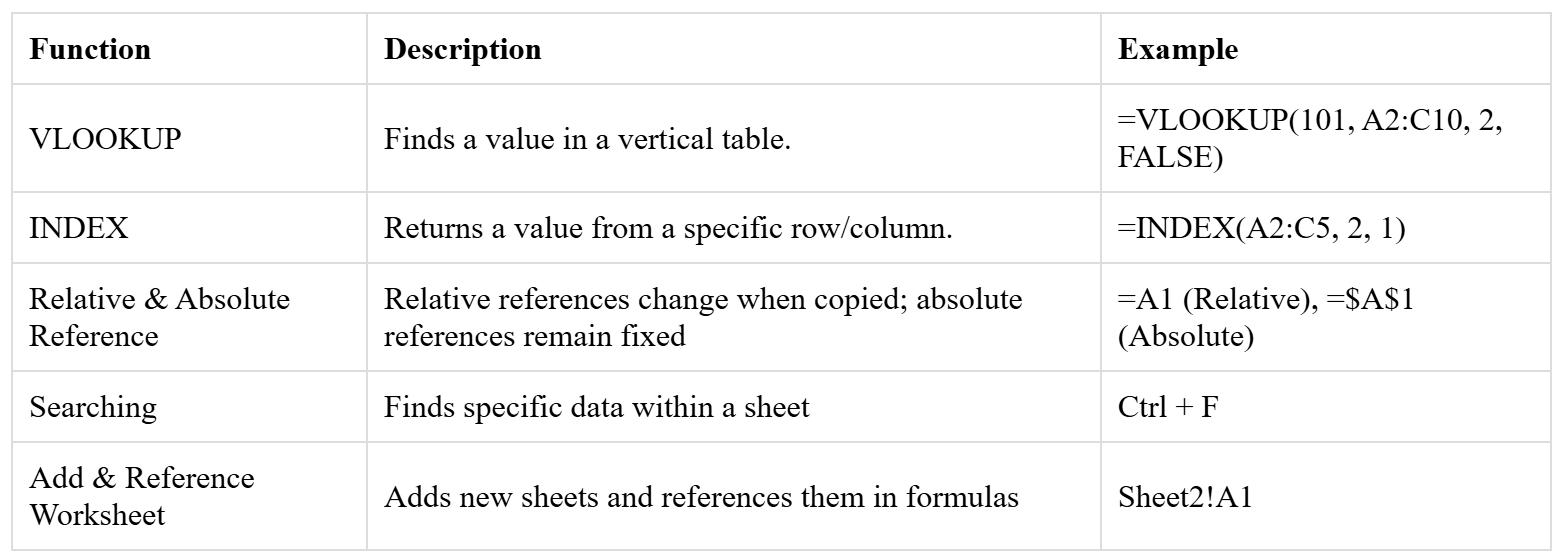
The VLOOKUP() and HLOOKUP() functions are used to find specific data in a table. The INDEX() and MATCH() functions can also be combined to retrieve values from large datasets by searching for matching values in different rows or columns.
Fill & Series Feature
To automatically fill a pattern of data in a row or column:
- Enter the first two values of the series in adjacent cells
- Select both cells and drag the fill handle (bottom-right corner of the selection) to extend the series
- Release the mouse to apply the pattern to the selected range
Charting
To create a chart in Excel:
- Select the data you want to visualize
- Go to the Insert tab and choose a chart type (e.g., Bar, Line, or Pie Chart)
- Customize the chart using the Chart Tools to add titles, labels, and legends
Sorting
To sort data in Excel:
- Select the data range to be sorted.
- Go to the Data tab and click Sort
- Choose the column by which to sort and select ascending or descending order
- Click OK to apply the sorting
To create a chart in Excel, first select the data range you want to visualize, then go to the Insert tab, and choose the chart type you prefer. You can further customize the chart by adding titles, labels, and adjusting the layout.
To filter data in Excel, select the range of data you want to filter, go to the Data tab, and click Filter. Then, use the drop-down arrows in the column headers to apply the desired filter criteria.