Normal Approximation
The normal approximation to the binomial distribution helps us estimate binomial probabilities using a continuous normal distribution. The binomial distribution describes the number of successes in a fixed number of independent trials, each with the same probability of success, \(p\). However, calculating probabilities for a large number of trials, \(n\), can be complex.
By using the normal distribution as an approximation, it simplifies these calculations. The normal approximation to the binomial distribution is possible when the number of trials is sufficiently large and both \(np\) and \(nq\), where \(q = 1 - p\), are greater than 5.
Furthermore, since the Binomial Distribution is discrete and the Normal Distribution is continuous, we use a continuity correction. This simply means adding or subtracting 0.5 to account for the difference between discrete and continuous data.
Formulas
Mean of Binomial DistributionThe mean of the binomial distribution is calculated as follows:
Where:
- \(\mu\) is the mean of the binomial distribution
- \(n\) is the number of trials
- \(p\) is the probability of success on a single trial
Standard Deviation
The standard deviation of the binomial distribution is found using this formula:
Where:
- \(\sigma\) is the standard deviation of the binomial distribution
- \(n\) is the number of trials
- \(p\) is the probability of success on a single trial
- \(q = 1 - p\), the probability of failure
Z-Score
The \(Z\)-Score converts a binomial value to a standard normal value with this equation:
Where:
- \(z\) is the \(Z\)-Score (standardized value)
- \(x\) is the observed value (i.e. number of successes)
- \(\mu\) is the population mean
- \(\sigma\) is the population standard deviation
Example
A coin is flipped 30 times. What is the probability of getting exactly 15 heads using the normal approximation to the binomial distribution? Let \(p = 0.5\).
First, we can identify the given information:
- Number of trials: \(n = 30\)
- Probability of success: \(p = 0.5\)
- Probability of failure: \(q = 1 - p = 0.5\)
- Observed number of successes: \(x = 15\)
Next, we can calculate the mean as such:
\(\mu = np\)
\(\mu = 30 \times 0.5\)
\(\mu = 15\)
Then, we can calculate the Standard Deviation using the following formulas:
\(\sigma = \sqrt{npq}\)
\(\sigma = \sqrt{30 \times 0.5 \times 0.5}\)
\(\sigma = \sqrt{7.5} \approx 2.738 \)
Since we are looking for exactly 15 heads, we need to apply the continuity correction and adjust the interval from 14.5 to 15.5.
After, we can calculate the \(Z\)-Scores using the following formula:
We can substitute the values and solve as such. We can first determine the \(Z\)-Score for \(z_{14.5}\):
\(z_{14.5} = \cfrac{14.5 - 15}{2.738}\)
\(z_{14.5} = \cfrac{-0.5}{2.738}\)
\(z_{14.5} \approx -0.183 \)
We can then determine the \(Z\)-Score for \(z_{15.5}\):
\(z_{15.5} = \cfrac{15.5 - 15}{2.738}\)
\(z_{15.5} = \cfrac{0.5}{2.738}\)
\(z_{15.5} \approx 0.183\)

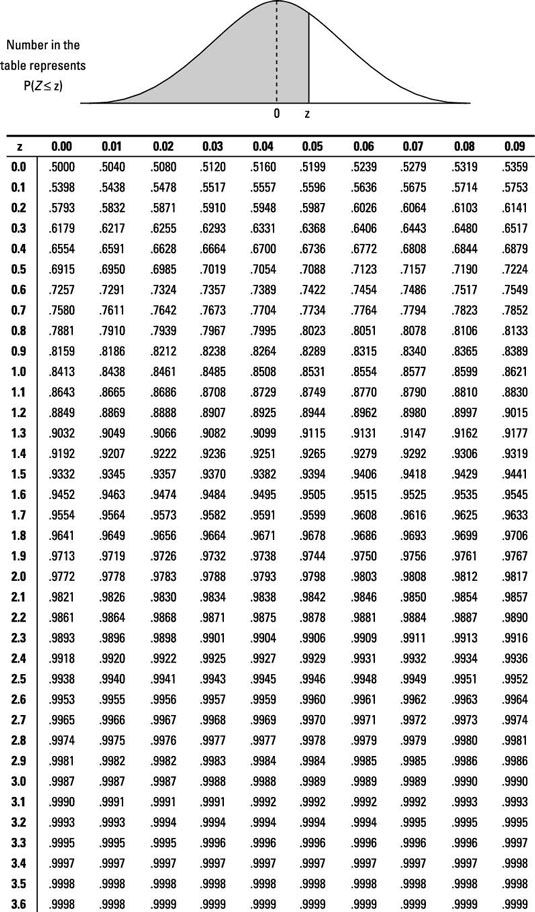
Using the \(Z\)-Score table above, since 0.183 is close to 0.18, we use these values. A \(Z\)-Score of 0.18 corresponds to a cumulative probability of approximately 0.5717, and a \(Z\)-score of -0.18 corresponds to a cumulative property of approximately 0.4286.
This gives a cumulative probability from \(z = -0.183\) to \(z = 0.183\). To find the probability between these values, we can subtract the lower cumulative probability from the upper cumulative probability:
\(P(14.5 \leq X \leq 15.5) = P(Z < 0.183) - P(Z < -0.183)\)
\(P(14.5 \leq X \leq 15.5) = 0.5717 - 0.4286 = 0.1431\)
\(P(14.5 \leq X \leq 15.5) = 0.1431\)
Therefore, we can determine that the probability of getting exactly 15 heads is approximately 0.143 or 14.3%.
A survey shows that 40% of people prefer chocolate ice cream. In a random sample of 100 people, what is the probability that between 35 and 45 people (inclusive) prefer chocolate ice cream? Use the normal approximation to the binomial distribution.
First, we can identify the given information:
- Number of trials: \( n = 100 \)
- Probability of success: \( p = 0.4 \)
- Probability of failure: \( q = 1 - p = 0.6 \)
Next, we can calculate the Mean as such:
\(\mu = np\)
\(\mu = 100 \times 0.4\)
\(\mu = 40\)
Then, we can calculate the Standard Deviation as such:
\(\sigma = \sqrt{npq}\)
\(\sigma = \sqrt{100 \times 0.4 \times 0.6}\)
\(\sigma = \sqrt{24} \approx 4.899\)
Since we are looking for between \(35\) and \(45\) people (inclusive), we apply the Continuity Correction and adjust the interval from 34.5 to 45.5.
We can calculate the \(Z\)-scores using the following formula:
We can now substitute the values and solve. We can first determine the \(Z\)-Score for 34.5:
\(z_{34.5} = \cfrac{34.5 - 40}{4.899}\)
\(z_{34.5} = \cfrac{-5.5}{4.899}\)
\(z_{34.5} \approx -1.123\)
We can then determine the \(Z\)-Score for 45.5:
\(z_{45.5} = \cfrac{45.5 - 40}{4.899}\)
\(z_{45.5} = \cfrac{5.5}{4.899}\)
\(z_{45.5} \approx 1.123 \)
Using the \(Z\)-Score table from the Example above, since 1.123 is close to 1.12, we will use these values. A Z-Score of 1.12 corresponds to a Cumulative Probability of approximately 0.8686, and a Z-Score of -1.12 corresponds to a Cumulative Probablity approximately 0.1314.
This gives a cumulative probability from \(z = -1.123 \) to \(z = 1.123\). To find the probability between these values, we can subtract the lower cumulative probability from the upper cumulative value:
\(P(34.5 \leq X \leq 45.5) = P(Z < 1.123) - P(Z < -1.123)\)
\(P(34.5 \leq X \leq 45.5) = 0.8686 - 0.1314\)
\(P(34.5 \leq X \leq 45.5) = 0.7372\)
Therefore, we can determine the probability that between 35 and 45 people prefer chocolate ice cream is approximately 0.737 or 73.7%.
A company produces light bulbs, and 2% of them are defective. If 500 light bulbs are selected at random, what is the probability that between 8 and 12 bulbs (inclusive) are defective, using the normal approximation to the binomial distribution? Apply the continuity correction where necessary.
First, we can identify the given information:
- Number of trials: \(n = 500\)
- Probability of success (defective): \(p = 0.02\)
- Probability of failure: \(q = 1 - p = 0.98\)
Next, we can determine the Mean as such:
\(\mu = np\)
\(\mu = 500 \times 0.02\)
\(\mu = 10\)
Then, we can determine the Standard Deviation as such:
\(\sigma = \sqrt{npq}\)
\(\sigma = \sqrt{500 \times 0.02 \times 0.98}\)
\(\sigma = \sqrt{9.8} \approx 3.130\)
Since we are looking for between 8 and 12 defective bulbs (inclusive), we apply the Continuity Correction and adjust the interval from 7.5 to 12.5.
We can calculate the \(Z\_-Scores using the followig formula:
We can now substitute the values and solve as such. We can first determine the \(Z\)-Score for 7.5:
\(z_{7.5} = \cfrac{7.5 - 10}{3.130}\)
\(z_{7.5} = \cfrac{-2.5}{3.130}\)
\(z_{7.5} \approx -0.799 \)
We can then determine the \(Z\)-Score for 12.5:
\(z_{12.5} = \cfrac{12.5 - 10}{3.130}\)
\(z_{12.5} = \cfrac{2.5}{3.130}\)
\(z_{12.5} \approx 0.799 \)
Using the \(Z\)-Score Table from the Example above, since 0.799 is close to 0.80, we use these values. A Z-Score of 0.80 corresponds to a cumulative probability of approximately 0.7881, and a Z-Score of -0.80 corresponds to approximately 0.2119.
This gives a cumulative probability from \(z = -0.799 \) to \(z = 0.799\). To find the probability between these values, subtract the lower cumulative probability from the upper cumulative probability:
\(P(7.5 \leq X \leq 12.5) = P(Z < 0.799) - P(Z < -0.799)\)
\(P(7.5 \leq X \leq 12.5) = 0.7881 - 0.2119\)
\(P(7.5 \leq X \leq 12.5) = 0.5762\)
Therefore, we can determine the probability that between 8 and 12 bulbs are defective is approximately 0.576 or 57.6%.