Organized Counting with Venn Diagrams

Venn diagrams are a a tool for analysing situations where there is some overlap among groups of items, or sets.

Circles represent different sets and a rectangular box around the circles represents the universal set, \(S\), from which all the items are drawn:


Fig.1 - The common elements are a subset of both A and B

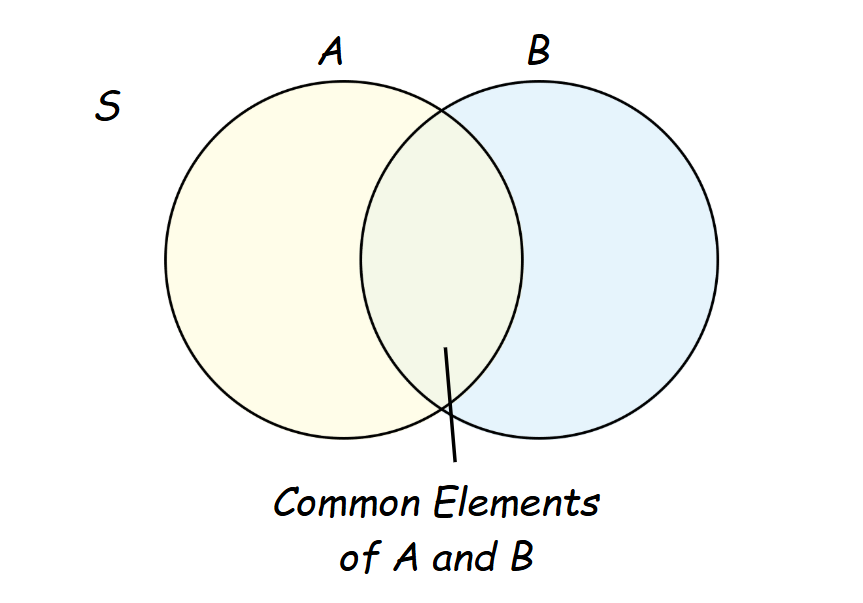
Elements, or members, are terms often used to describe the items in a set. When some elements of one set are also part of another, these are referred to as common elements.

Visually, this relationship is depicted using overlapping circles. Furthermore, if every element of set \(C\) is also an element of set \(A\), then set \(C\) is considered a subset of set \(A\).


Example

Suppose in a recent survey of 120 employees at a company, 80 participated in a professional development workshop, 50 received one-on-one coaching from a senior manager, and 30 employees engaged in both activities. Determine the number of employees that didn't participate in either of the activities.

We can subtract the overlap from each group's total to find unique participants:

  • Professional Development only: \(80 - 30 = 50\)
  • Coaching only: \(50 - 30 = 20\)

We can visulize the number of participants using a Venn Diagram:


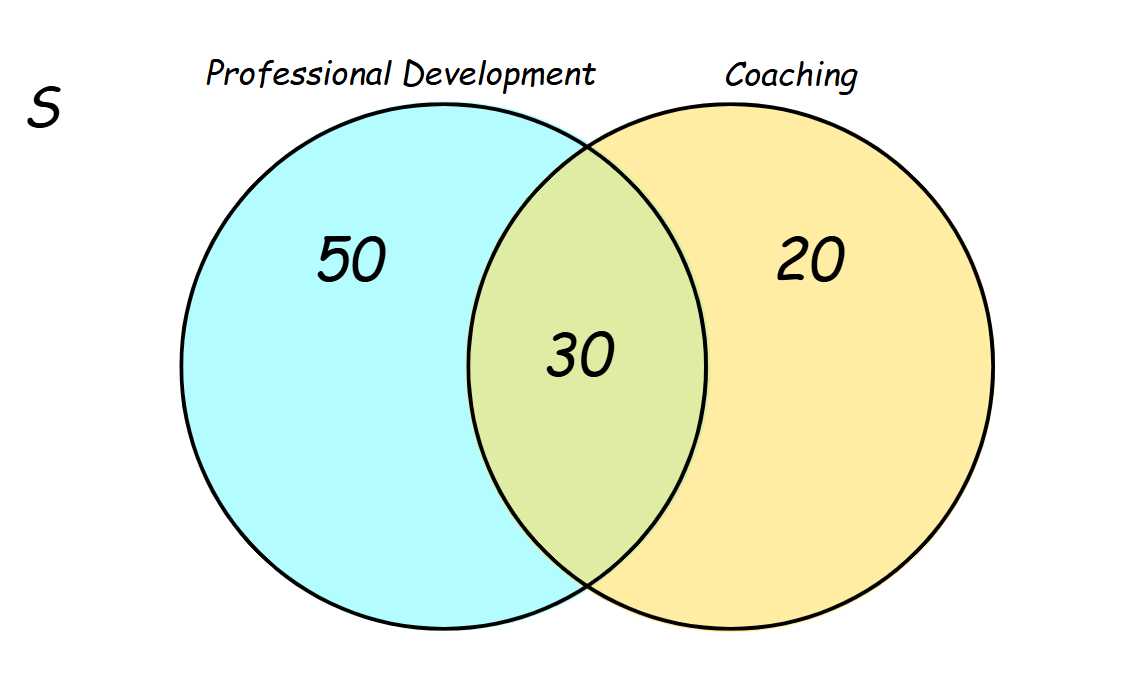
Therefore, we can determine the total number of employees not participating in any activity is 20.


There are 12 students on the soccer team and 18 on the hockey team. When organizing a joint practice session, the coach needs to secure transportation for only 22 students. Use a Venn diagram to visualize this setup.

  1. Determine the number of students on both teams
  2. Calculate the number of students exclusively in each team's section of the diagram and describe the significance of these sections

i. The total number of students attending the practice is \(22\). If we add the students on the soccer team (\(12\) students) and the hockey team (18 students) without considering any overlap, we would incorrectly calculate a total of \(30\) students.

To find the actual number of students on both teams, we subtract the total students attending from this sum:

\(\text{Students}_{(\text{Both})} = 12 + 18 - 22 = 8\)

\(\text{Students}_{(\text{Both})} = 8\)

Therefore, we can determine that 8 students are on both teams.


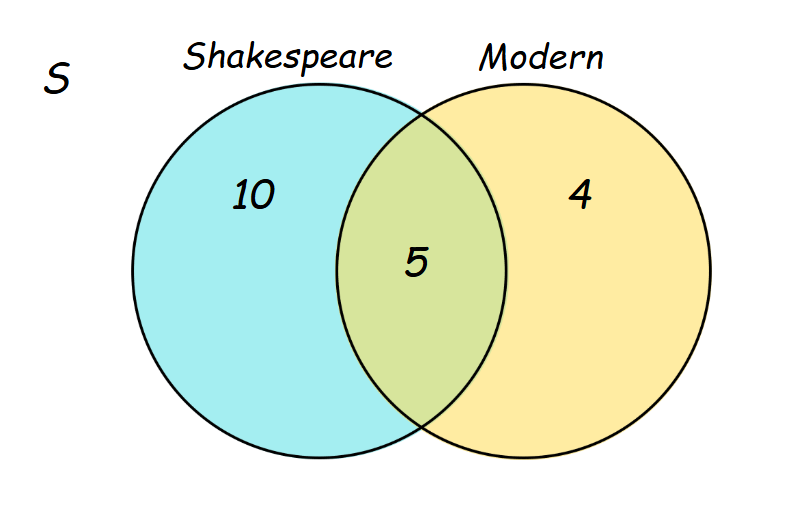
ii. The number of students exclusively on the soccer team is:

\(\text{Students}_{(\text{Soccer})} = 12 - 8\)

\(\text{Students}_{(\text{Soccer})} = 4\)

  The number of students exclusively on the hockey team is:

\(\text{Students}_{(\text{Hockey})} = 18 - 8\)

\(\text{Students}_{(\text{Hockey})} = 10\)


The Venn diagram should reflect these calculations with 8 in the overlapping area, 4 in the Soccer only section, and 10 in the Hockey only section.


Principle of Inclusion and Exclusion for Two Sets

For sets \(A\) and \(B\), the total number of elements in either \(A\) or \(B\) is the number in \(A\) plus the number in \(B\) minus the number in both \(A\) and \(B\).

\(n(A \cup B) = n(A) + n(B) - n(A \cap B) \)

The set of all elements in either set \(A\) or set \(B\) is the union of \(A\) and \(B\), which is often written as \(A \cup B\). Similarly, the set of all elements in both \(A\) and \(B\) is the intersection of \(A\) and \(B\), written as \(A \cap B\). Thus the principle of inclusion and exclusion for two sets can also be stated as:

\(n(A \cup B) = n(A) + n(B) - n(A \cap B)\)

It should be noted that the additive counting principle, also known as the rule of sum, is essentially a specific instance of the principle of inclusion and exclusion, applicable exclusively when sets \(A\) and \(B\) share no common elements, so that \(n(A \cap B) = 0\). The principle of inclusion and exclusion can also be applied to three or more sets.


Example

A school's art department is hosting an art show with two galleries: one features 18 watercolor paintings, and another showcases 12 oil paintings. If 5 paintings are displayed in both galleries, use the principle of inclusion and exclusion to determine the total number of unique paintings exhibited.

\( n(\text{Total Unique}) = n(\text{Watercolors}) + n(\text{Oils}) - n(\text{Both}) \)

\(= 18 + 12 - 5 \)

\(= 25\)

The total number of unique paintings exhibited were 25.


A drama club is staging two productions: a Shakespearean play with 15 actors and a modern drama with 9 actors.

  1. If 5 actors are involved in both plays, how many actors are there in total?
  2. Use a Venn diagram to calculate how many actors participate in only one of the two plays.

i. We can determine the number of actors involved in both plays using the Principle of Inclusion and Exclusion:

\(n(\text{total}) = n(\text{Shakespeare}) + n(\text{Modern}) - n(\text{Shakespeare and Modern})\)

\(n(\text{total}) = 15 + 9 − 5\)

\(n(\text{total}) = 19\)

Therefore, we can determine there are 19 students involved in the two one-act plays.


ii. There are 5 actors in the overlap between the two circles. In order to determine the number of actors exclusive to the Shakespearean play, we can subtract the overlap from the total number of actors in that play:

\(\text{Shakespeare} = 15 - 5\)

\(\text{Shakespeare} = 10\)

In order to determine the number of actors exclusive to the Modern Drama, we can subtract the overlap from the total number of actors in that play:

\(\text{Modern Drama} = 9 - 5\)

\(\text{Modern Drama} = 4\)

We can determine the number of actors that are only in one play by adding the amounts:

\(\text{Actors}_{(\text{One})} = 10 + 4\)

\(\text{Actors}_{(\text{One})} = 14\)

Therefore, we can determine a total of 14 actors are only in one of the two plays.

We can visually represent the number of actors in each play using a Venn Diagram:


The Venn diagram should reflect these calculations with 5 in the overlapping area, 10 in the Shakespearean play only section, and 4 in the modern drama only section.