Trigonometric Functions
Trigonometric Functions consist of 3 algebraic functions that incorporate trigonometric ratios. The main trigonometric functions are sine, cosine, and tangent. They can be expressed algebraically as functions:
Trigonometric Functions are periodic since they repeat themselves at regular intervals.
Trigonometric Functions can be applied to model real-world processes that are a lot more advanced from analyzing the values of a right triangle. Such applications include math, physics, medicine, and engineering.
Types of Trigonometric Functions
Sine Functions
Sine Functions are trigonometric functions that can be expressed algebraically as:
They are represented graphically as:
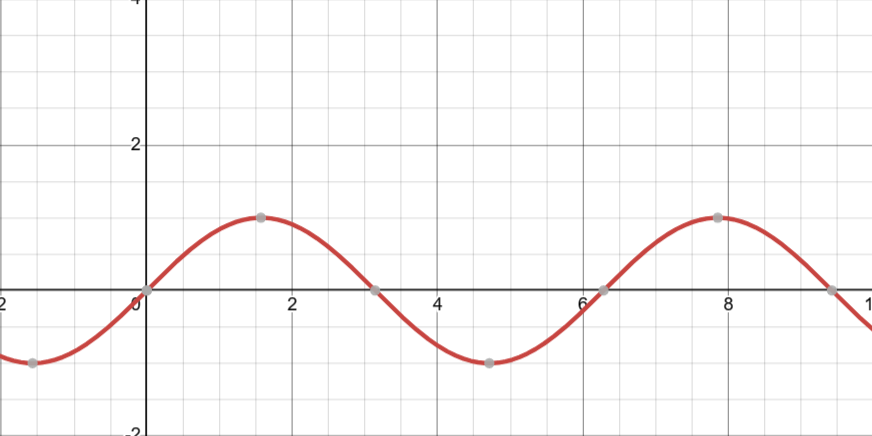
Recall that the sine trigonometric ratio is related to the y-coordinate of a point on the unit circle. This definition can help us understand the nature of the plot. If we draw a point at \(0°\), the corresponding point is \((1,0)\), i.e., the y-coordinate is \(0\). The \(y\)-coordinate will become \(1\) at an angle of \(90°\) or \(2\) at the point \((0,1)\).
Cosine Functions
Cosine Functions are trigonometric functions that can be expressed algebraically as:
They are represented graphically as:
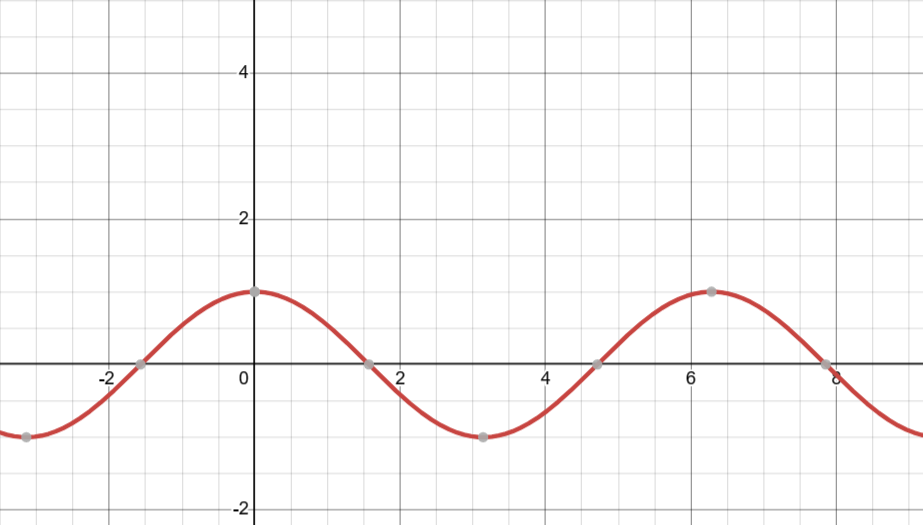
Recall that the cosine trigonometric ratio is related to the \(x\)-coordinate of a point on the unit circle. It starts at \(1\) and then decreases until it is \(0\) at an angle of \(\cfrac{\pi}{2}\). Then, it becomes negative.
Tangent Functions
Tangent Functions are trigonometric functions that can be expressed algebraically as:
They are represented graphically as:
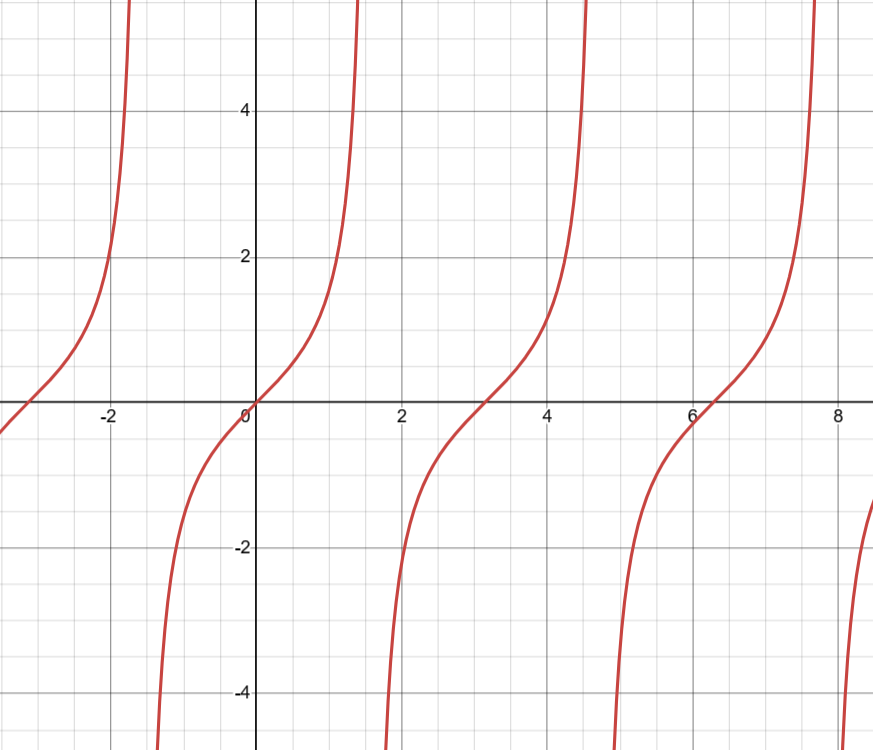
Recall that the tangent trigonometric ratio is related to the slope of a line going to a point on the unit circle. It starts at \(0\) (horizontal) and then increases until it is infinity (vertical) at an angle of \(\cfrac{\pi}{2}\). Then, it becomes negative.
Characteristics of Trigonometric Functions
Period
The Period represents the length of time (or interval) needed to complete a full cycle. Graphically, the period can be represented as the distance between \(2\) max or min points.
A full cycle for sine or cosine functions last for \(2π\) rads by default and can be determined algebraically by dividing the full length of a revolution, \(2π\), by the function’s horizontal stretch factor, \(k\). This is expressed as:
In contrast to sine and cosine functions, the full cycle for a default tangent function lasts for only \(\pi\) rads.
Phase Shift
The Phase Shift represents the horizontal displacement of a periodic function in relation to its reference cycle. You saw in a previous lesson that the following identities are true:
| \(\sin(x) = \cos\left(\cfrac{\pi}{2} - x\right)\) | \(\cos(x) = \sin\left(\cfrac{\pi}{2} - x\right)\) | \(\sin\left(x + \cfrac{\pi}{90}\right) = \cos(x)\) |
These equations represent phase shifts which means if you shift the graphs of sin and cos, they end up being the same! Take a look at the graphs from above. Imagine moving the sine graph backwards by \(\cfrac{\pi}{2}\), it should match up with the cosine graph!
Maxima/Minima
The Maxima and Minima respectively represent the highest and lowest points of a periodic function
Sine and cosine functions contain default max and min points of \(1\) and \(-1\) respectively. These extrema exist at intervals of \(\cfrac{\pi}{2}\) for sine functions and for cosine functions. Tangent functions, in contrast, don’t contain any extrema.
Axis of Symmetry
The Axis of Symmetry is a horizontal line that lies between the max and min points of a sine or cosine function. Although it is measured as \(0\) by default, translating the function vertically by \(c\) units change its axis in tandem.
For sine and cosine functions, the axis can be determined algebraically by finding the average between the difference of their max and in points. This is expressed as:
An Axis of Symmetry doesn’t exist for tangent functions since they don’t contain max or min points.
Amplitude
The amplitude represents the vertical distance from the axis to either the max or min points. Although is measured as \(1\) by default, multiplying the trigonometric function by a constant, a, changes its amplitude by that factor.
Amplitude only exists for sine and cosine functions. For those functions it can be determined algebraically by finding the average between the sum of their max and min points. This is expressed as:
Amplitude doesn’t exist for tangent functions since they don’t contain max or min points.
Domain
The Domain of trigonometric functions are its input values. For sine and cosine functions, it is represented as \(x\) as an element of all real numbers, or {\(x\in\mathbb{R}\)}.
The domain can be limited to a specific range of values, normally expressed in multiples of such as [\(-2\pi, 2\pi\)].
For tangent functions, the range is represented as \(x\) as an element of all real numbers except for odd multiples of \(\cfrac{\pi}{2}\), or {\(x∈R | x ≠ 2(2n+1)\)}.
Range
The Range of trigonometric functions are its output values. For sine and cosine functions, it is represented as \(y\) as an element of all real numbers between \(-1\) and \(1\), or \(\{y\in\mathbb{R} |-1 \le y \le 1\}\). For tangent functions, the range can be represented as \(y\) as an element of all real numbers or \(\{y\in\mathbb{R}\}\).
Vertical Asymptotes
Vertical Asymptotes are vertical lines that a function cannot cross, thereby restricting its domain. Vertical Asymptotes only exist for tangent functions, with each of them being or \(180°\) apart from each other. The equations of the tangent’s asymptotes can be represented algebraically as:
Where \(n\) is an integer. This means that each asymptote is located at an odd multiple of \(\cfrac{\pi}{2}\).
Example
Determine the period, amplitude, axis, domain, and range for the following function:
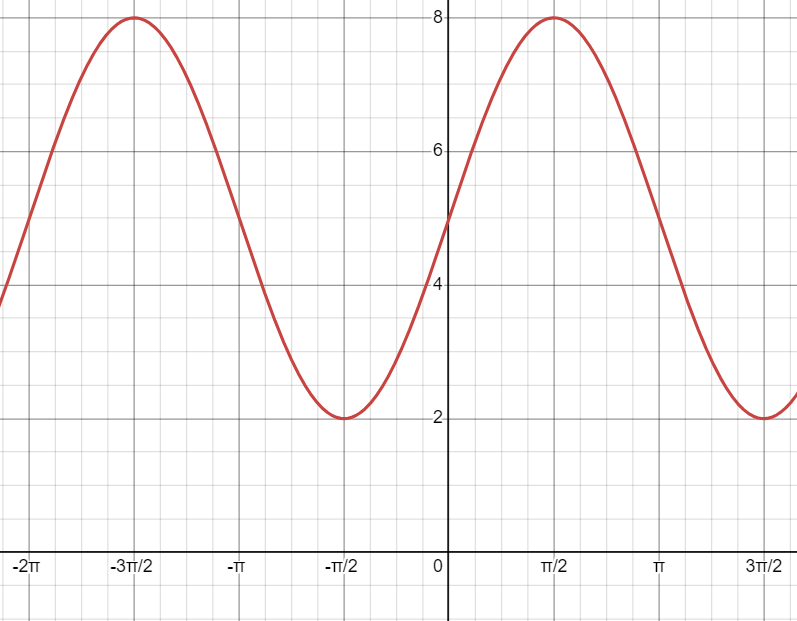
First, we can determine the period by measuring the distance between 2 extrema. In this instance, we will use the peaks at \(-\cfrac{3\pi}{2}\) and \(\cfrac{\pi}{2}\):
\(\text{period} = \boldsymbol{2\pi}\)
Next, we can determine that the function has a maximum point at \(8\) and a minimum point at \(2\).
Using this information, we can determine the amplitude as such:
\(\text{amplitude} = \cfrac{8 - 2}{2}\)
\(\text{amplitude} = \cfrac{6}{2}\)
\(\text{amplitude} = \boldsymbol{3}\)
We can also determine the axis as such:
\(\text{axis} = \cfrac{8 + 2}{2}\)
\(\text{axis} = \cfrac{10}{2}\)
\(\text{axis} = \boldsymbol{5}\)
Given that this function is continuous, we can determine that its domain is \(\boldsymbol{\{x \in \mathbb{R}\}}\).
Given that this function has a max at \(8\) and min at \(2\), its range can be represented as \(\boldsymbol{\{y \in R| 2 \leq y \leq 8\}}\).
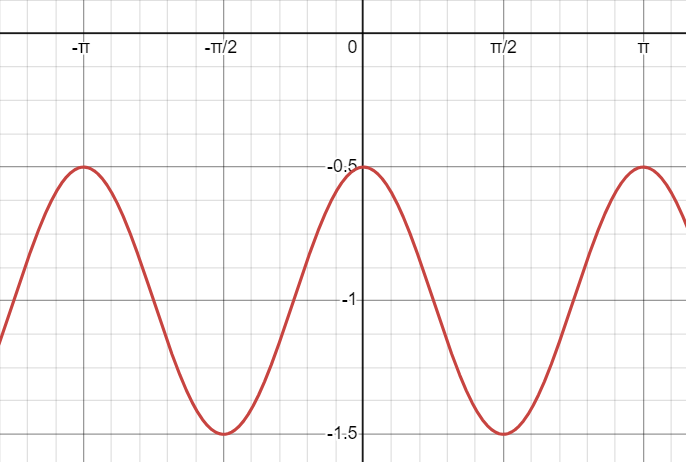
First, we can determine the period by measuring the distance between 2 extrema. In this instance, we will use the peaks at \(-\pi\) and \(0\):
\(\text{period} = 0 - (-\pi)\)
\(\text{period} = \boldsymbol{\pi}\)
Next, we can determine that the function has a maximum point at \(-0.5\) and a minimum point at \(-1.5\).
Using this information, we can determine the amplitude as such:
\(\text{amplitude} = \cfrac{-0.5 - (-1.5)}{2}\)
\(\text{amplitude} = \cfrac{1}{2}\)
\(\text{amplitude} = \boldsymbol{0.5}\)
We can also determine the axis as such:
\(\text{axis} = \cfrac{-0.5 + (-1.5)}{2}\)
\(\text{axis} = \cfrac{-2}{2}\)
\(\text{axis} = \boldsymbol{-1}\)
Given that this function is continuous, we can determine that its domain is \(\boldsymbol{\{x \in \mathbb{R}\}}\).
Given that this function has a max at \(-0.5\) and min at \(-1.5\), its range can be represented as \(\boldsymbol{\{y \in \mathbb{R}| -1.5 \leq y \leq -0.5\}}\).