Review of Functions
A Function is a relation between a set of inputs (domain) and a set of possible outputs (codomain). Each input is related to exactly one output. The function is typically represented by a rule, formula, or algorithm that describes how the input values are mapped to the corresponding output values.
A Non-Function is a relation where an element in the domain can be associated with more than one element in the codomain. There is no uniqueness, therefore multiple outputs are possible for a single input. For example, an \(x\) value that has multiple \(y\) values.
Common Types of Functions
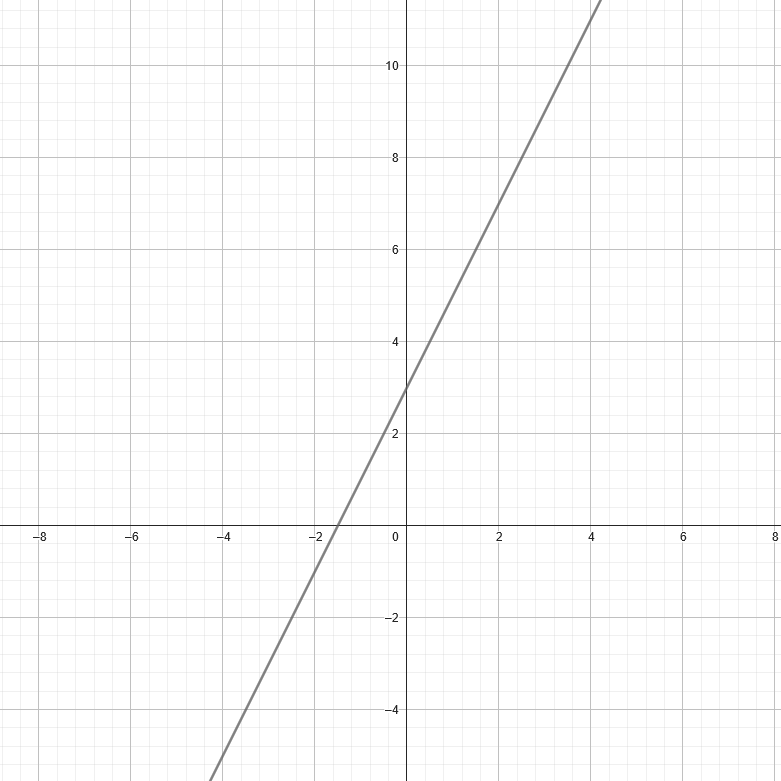
Linear Functions
A function in the form of:
- \(m\) represents the slope
- \(x\) represents the input value or domain
- \(b\) represents the vertical shift (or \(y\)-intercept)
A Linear Function is represented as a straight line on a graph. It can be represented visually as:
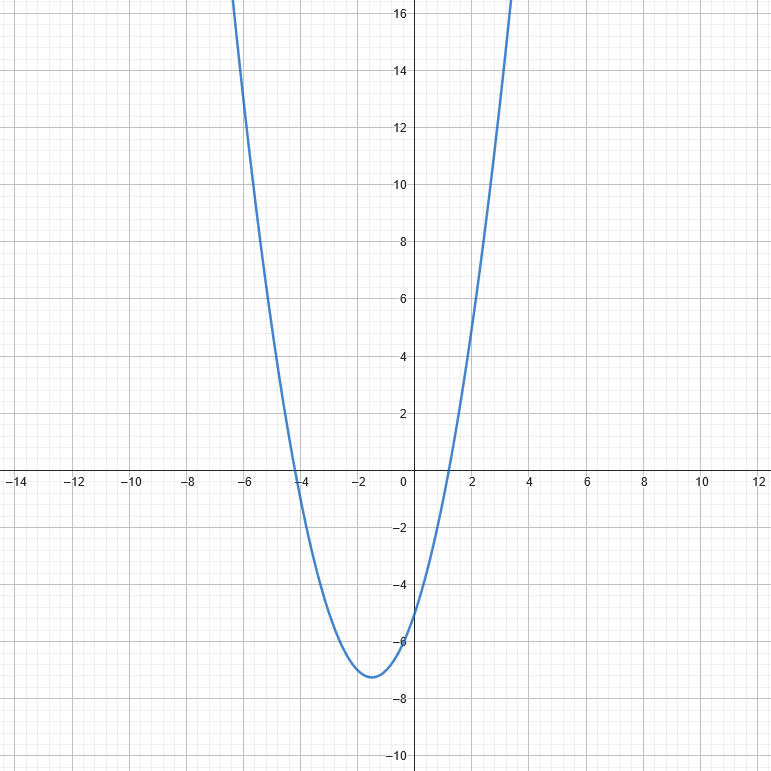
Quadratic Functions
A function in the form of:
- \(a\) represents the direction and steepness of the parabola
- \(b\) influences the location of the parabola's axis
- \(c\) represents the vertical shift (or \(y\)-intercept)
A Quadratic Function is represented as a U-shape (or parabola) on a graph. It can be represented visually as:
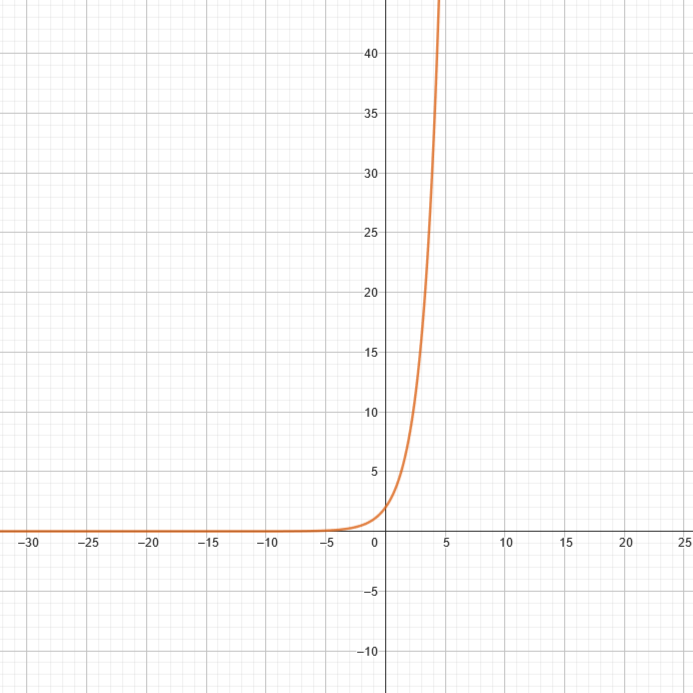
Exponential Functions
A function in the form of:
- \(a\) represents the constant multiplier for the entire function and vertically scales the function
- \(b\) represents the coefficient of \(x\) which determines the slope and direction of the linear part of the function
- \(x\) represents the independent variable or input (domain) of the function
An Exponential Function is represented as either a rapidly increasing or decreasing curve on a graph. It can be represented visually as:
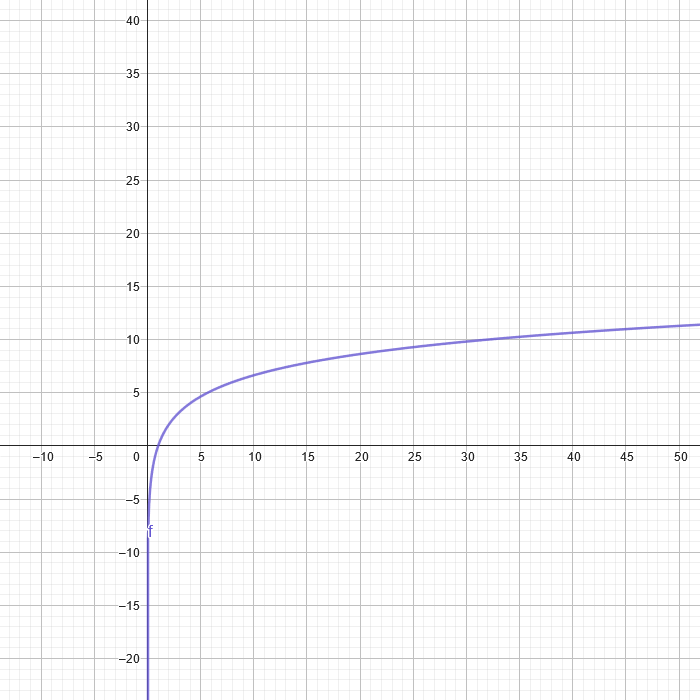
Logarithmic Functions
A function in the form of:
- \(\log_a\) indicates a logarithmic function with base \(a\)
- \(x\) is the independent variable for input (domain)
An Exponential Function is represented as the inverse of \(f(x)=a^x\) exponential function; as such, it will mirror its exponential counterpart. A Logarithmic Function can be represented visually as:
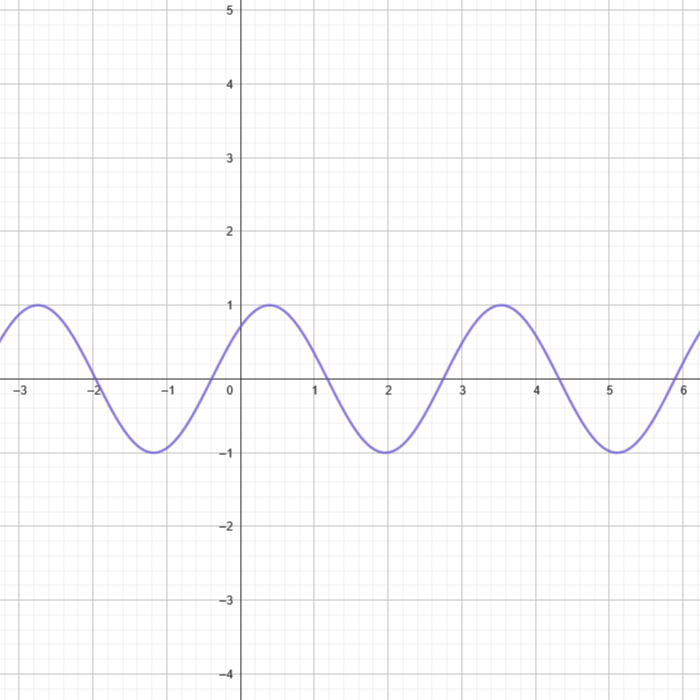
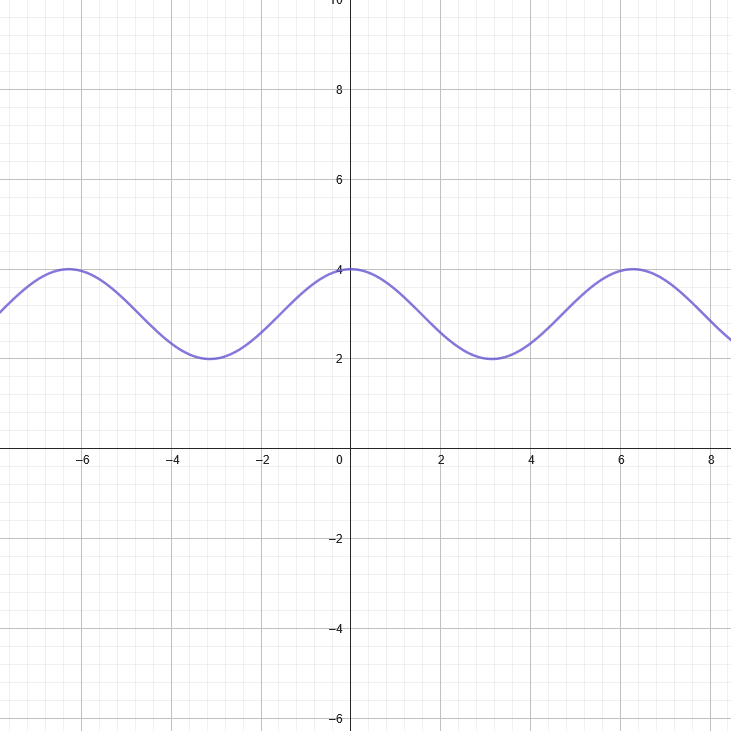
Trigonometric Functions
Functions that represent mathematical relationships between an angle and the ratios of sides in a right angled triangle or the coordinates on the unit circle. They can be represented in the form:
- \(A\) represents the amplitude (or height)
- \(B\) represents the frequency and period
- \(C\) represents the phase shift
- \(D\) represents the vertical shift
\(\sin\) can be replaced by other trigonometric functions (\(\cos\), \(\tan\), etc.). Trigonometric Functions are represented as waves that continously oscillate between peaks and valleys. They can be represented visually as:
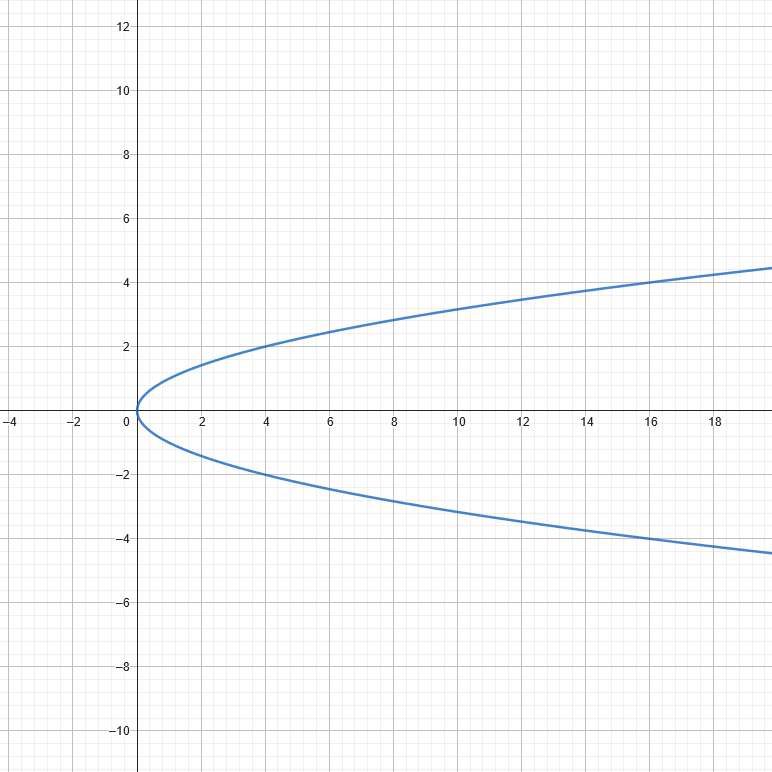
Non-Functions
A function that refers to a relationship that violates the definition of a function. In a true function, there is one unique output for every input, any relation that doesn't follow this rule is a non-function. For example, the relation \(y^2=x\), as shown below, isn't a function since it's shown in the graph that the \(x\) values from \(0\) and upward have two values at each domain.
Review
Move each function into the correct category.
\(f(x)=\log_2(x)\)
\(f(x)=2x+3\)
\(f(x)=2 \cdot 2^x\)
\(y^2=x^4\)
\(f(x)=-x^2+4x+7\)
\(f(x)=\cos(x)\)
\(f(x)=3x-1\)
\(f(x)=3 \cdot 2^x\)
\(f(x)=\log_3(x)\)
\(f(x)=\sin(x)\)
\(f(x)=3\)
\(f(x)=x^2+3x-5\)