Factored Form
Factored Form is often used to represent polynomial functions. When a function is in factored form, the \(x\)-intercepts (also referred to as roots or zeroes) can easily be identified, as well as a clear understanding of the functions behaviour.
Take a look at the function \(f(x)=(x-1)(2x-2)(x-2)\). The \(x\)-intercepts can easily be identified as \(1\), \(-0.5\), and \(2\) by setting the \(y\) value to \(0\) and solving each set of parentheses individually. The graphed function is shown below and the \(x\)-intercepts and easily be indentified.

To identify how a function behaves, we look at the multiplicities of the zeroes of the function. Multiplicities refer to the number of times a particular zero (root) of a polynomial occurs. If the multiplicity is \(1\), a straight line is represented, if the multiplicity is \(2\), a parabola is represented and the \(x\)-intercept is the result of the parabola bouncing off \(x=0\), and if the multiplicity is \(3\), a cubic function behaviour will be represented on a graph and will curve around the \(x\)-intercept. This is the basic understanding, however the rule of thumb is, Even Multiplicity = Bounces X-Intercept and Odd Multiplicity = Passes Through X-Intercept.
Lets look at the function in factored form, \(f(x)=(x+1)^3(x-2)^2(x+3)\):
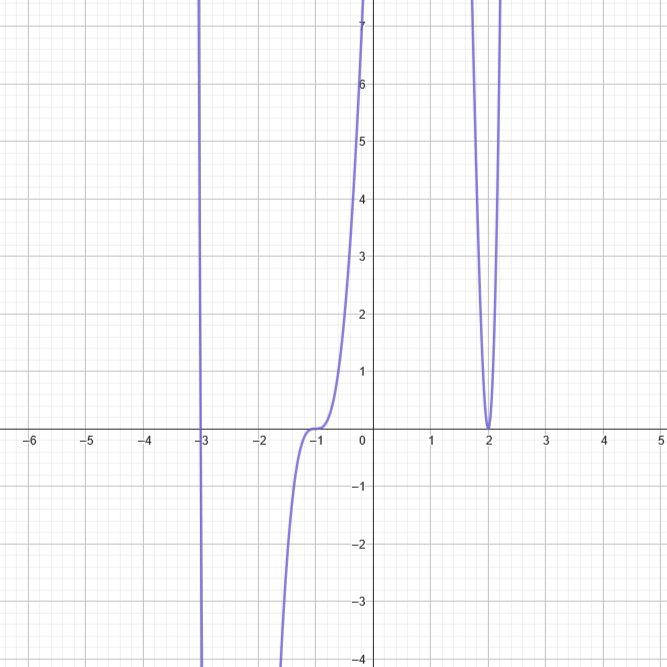
Easily identifiable are the \(x\)-intercepts, \(-3\), \(-1\), and \(2\). Also easily indentifiable are the behaviours around the \(x\)-intercepts. Where the root is \(-1\), the multiplicity is \(3\) therefore is function curves around that root. Where the root is \(2\), a parabola is formed in the function and bounces off the root. Where the root is \(-3\), the function passes through it resembling a straight line.
By using only the \(x\)-intercepts, multiplicities, and coefficients, it's quite simple to visualize a basic sketch of what the function would look like. For this example, consider the function \(f(x)=-2(x-1)(x+2)^2(x-2)\). From smallest to largest, the roots are, \(-2\), \(1\), and \(2\), and we also know that the coefficient is \(-2\).
- Since the root of \(-2\) has a multiplicity of \(2\), we known the function will bounce on \(x=-2\) and direct back in the same direction like a parabola
- Since the root of \(1\) has an inferred multiplicity of \(1\), the function will resemble a straight line and pass through \(x=1\)
- Since the root of \(2\) also has an inferred multiplicity of \(1\), the function will resemble a straight line and pass through \(x=2\)
Now that we have determined the function's behaviour around the roots, we can now determine the its behaviour based on the coefficient. The coefficient is \(-2\) which means the function will begin from the negative \(y\)-axis and come up to the \(x\)-axis.
Now lets piece it all together:
- The coefficient is \(-2\) therefore will start from below the \(x\)-axis and rise up.
- The function will bounce off \(x=-2\) before dropping back down.
- The function will rise back up at pass through \(x=1\) before hitting a peak above the \(x\)-axis.
- Finally, once the function hits the peak it will change direction and pass through \(x=2\) before descending infinitely back below the \(x\)-axis.
Here is the function represented on a graph:

Given the following polynomial functions:
- Find the \( x \)-intercepts (roots or zeroes) of the function
- Determine the multiplicity of each \( x \)-intercept
- Design a quick sketch of what the function should look like
\(g(x) = -2(x + 1)(x - 3)^2(x + 4)\)
i. In order to find the \(x\)-intercepts of the function, we can set it equal to zero and solve for \(x\):
When we solve for each factor separately, we can determine that \(\boldsymbol{x = -1, 3, -4} \).
ii. In order to determine the multiplicity of each \(x\)-intercept, we can identify the respective exponent of each factor.
The multiplicity of each \( x \)-intercept is:
- At \(x = -1\), the multiplicity is \(\boldsymbol{1}\)
- At \(x = 3\), the multiplicity is \(\boldsymbol{2}\)
- At \(x = -4\), the multiplicity is \(\boldsymbol{1}\)
iii. Before we sketch a graph of the function, we can identify the following characteristsics based on the \(x\)-intercepts and multiplicities:
- Coefficient is negative (\(-2\)), therefore function begins at the bottom and comes up towards first \(x\)-intercept
- At \(x = -4\), the function passes through the \(x\)-axis with a multiplicity of \(1\)
- At \(x = -1\), the function comes down and passes through the \( x \)-axis oand continues down due to a multiplicity of \(1\)
- At \(x = 3\), the function comes back up and bounces off the \(x\)-axis and continues down infinitely
We can graph the function as such:

\(h(x) = (x - 1)^2(x + 2)^3(x - 3)\)
i. In order to find the \(x\)-intercepts of the function, we can set it equal to zero and solve for \(x\):
Set the function equal to zero and solve for \( x \):
When we solve for each factor separately, we can determine that \(\boldsymbol{x = 1, -2, 3}\).
ii. In order to determine the multiplicity of each \(x\)-intercept, we can identify the respective exponent of each factor.
The multiplicity of each \(x\)-intercept is:
- At \(x = 1\), the multiplicity is \(\boldsymbol{2}\)
- At \(x = -2\), the multiplicity is \(\boldsymbol{3}\)
- At \(x = 3\), the multiplicity is \(\boldsymbol{1}\)
iii. Before we sketch a graph of the function, we can identify the following characteristsics based on the \(x\)-intercepts and multiplicities:
- Coefficient is positive \(1\) therefore function begins at the top and comes down towards first \(x\)-intercept
- At \(x = -2\), the function curves around the \(x\)-axis with a multiplicity of \(3\)
- At \(x = 1\), the function bounces off the \(x\)-axis due to a multiplicity of \(2\)
- At \(x = 3\), the function passes through the \(x\)-axis like a straight line and directs up infinitely
We can graph the function as such:
