Intro to Quadratics
Quadratics are Second-Order Polynomials. which take on the form:
In this form:
- \(x\) represents the independent variable
- \(y\) represents the dependent variable
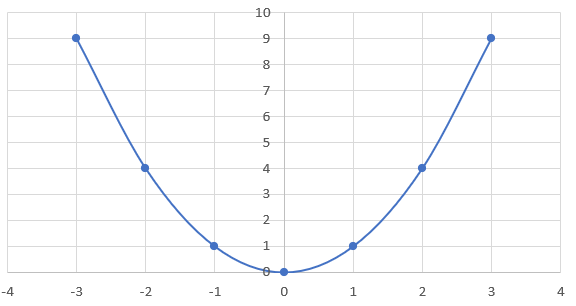
A quadratic is referred to as a second-order polynomial since the highest exponent of \(x\) in a non-zero term is \(2\). When a quadratic equation is represented visually, it is referred to as a parabola.
A quadratic function can be expressed algebraically in a few different ways:
- Standard Form: \(y = ax^2 + bx+ c\)
- Vertex Form: \(y = a(x - h)² + k\)
- Factored Form: \(y = a(x - r)(x - s)\)
Review these lessons:
Try these questions:
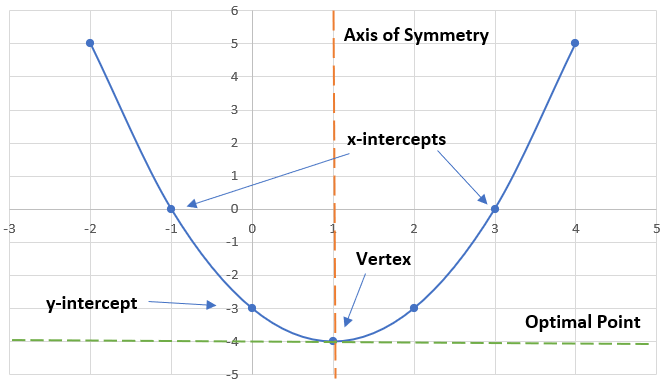
Characteristics of a Parabola
Direction of Opening
- The sign of \(a\) (\(+\) or \(-\)) will determine which direction the parabola will open
- If \(a\) is positive \( (a > 0) \), the parabola will open upwards; if \(a\) is negative \( (a < 0) \), the parabola will open downwards
Slope
- Isn't constant unlike a Linear Function
- Pattern can be described as positive, zero, negative
Stretch/Compression
- The magnitude of \(|a|\) will determine whether the parabola will be stretched or compressed
- If \(|a| > 1\), the parabola will be stretched, or will appear more narrow
- If \(|a| < 1\), the parabola will be compressed, or will appear more wide
x-intercepts
- Represent the roots, zeroes, or solutions of a quadratic equation
- Points where the parabola crosses the x-axis
- Can be determined algebraically by setting \(y = 0\) in the quadratic equation
y-intercept
- The point where the parabola crosses the \(y\)-axis
- Can be determined algebraically by setting \(x = 0\) in the quadratic equation
Vertex
This point acts as either the minimum or maximum point of a quadratic function.
The characteristics of the vertex depend on the sign of the \(a\) value in the quadratic equation:
- If \(a > 0\) or the parabola opens upward, the vertex will act as a minimum point
- If \(a < 0\) or the parabola opens downward, the vertex will act as a maximum point
Axis of Symmetry
- The vertical line the goes through the vertex
- Determines the \(x\)-coordinate of the vertex
- Can be determined algebraically by dividing the sum of the \(x\)-intercepts by \(2\)
Optimal Point
- The hoizontal line that goes through the vertex
- It determines the \(y\)-coordinate of the vertex
- Can be determined algebraically by using the Axis of Symmetry as the \(x\)-value in the quadratic equation
We can make this process easier for ourselves by first creating a table of values to identify if there any intercepts:
| x Values | -3 | -2 | -1 | 0 | 1 | 2 | 3 |
|---|---|---|---|---|---|---|---|
| y Values | 12 | 7 | 4 | 3 | 4 | 7 | 12 |
Based on this table, we can determine that there aren't any \(x\)-intercepts, as there aren't any cells where \(y = 0\). However, we can determine that there is a \(y\)-intercept of \(\boldsymbol{3}\), since \(y = 3\) when \(x = 0\).
To further confirm our results, we can graph this quadratic to get a better idea of how it looks visually. We will learn other techniques for finding \(x\)-intercepts soon:
